

One of the most common questions I get from my Nutanix colleagues, as well as customers and partners, is “How do I use the Nutanix APIs to get performance statistics?” Before we get started, please note this post is the second part in a two-part mini series. The first part, which is a recommended read before part 2, is available here: “Nutanix APIs – What are they and what does each one do?”
Storage Performance Statistics
I’ll start this section by saying one important thing. Some of the stats info below is in the process of being re-documented. Please keep this in mind, although this article will point out what is documented and what isn’t, when relevant.
Prism Element and Prism Central each show a ton of critically important info re various entity types. This includes VMs, storage containers, protection domains, blueprints, applications, network security rules and the cluster(s) themselves. A lot of that is generated from the Nutanix APIs, including parts of the performance information.
For this article, we’re talking about storage so, with that in mind, there are a few parameters to consider. Mandatory parameters:
- The metric you want to report on
- The UUID of the storage container
Optional parameters:
- The statistical interval you want to use: interval_in_secs. E.g. do you want performance statistics every 30 seconds? Every 60 seconds? Maybe every 43 seconds?
- The start time for the period you want to report on: start_time_in_usecs. This value must be in “usecs” i.e. the microseconds elapsed since Epoch/UNIX time began (Jan 1st, 1970). If you aren’t going to convert your dates and times programmatically, a good alternative is to use one of the many online converters. For example, EpochConverter. You may need to add the appropriate number of zeroes to convert the results from seconds to microseconds!
- The end time for the period you want to report on: end_time_in_usecs. As with the start time, this value must be in “usecs”.
If you omit the start and end times, the API will return the requested metric’s value at the time the request is submitted. However, what if we don’t know exactly which metric we want to use? Take a look at the following v2.0 API request.
https://<cluster_virtual_ip>:9440/api/nutanix/v2.0/storage_containers/After submitting a request like that, we can take the JSON response and examine it in JSON Editor Online
Important note: Using JSON Editor Online is optional. It is also not typically recommended to share confidential or sensitive information about your environment with any public service. Please keep this in mind before examining your site’s information in JSON Editor Online. Scrolling through the JSON response from that request, we’ll see a response similar to the one below. The request below has been run against the /vms/ endpoint, but illustrates the same type of output had we run it against the /storage_containers/ endpoint:
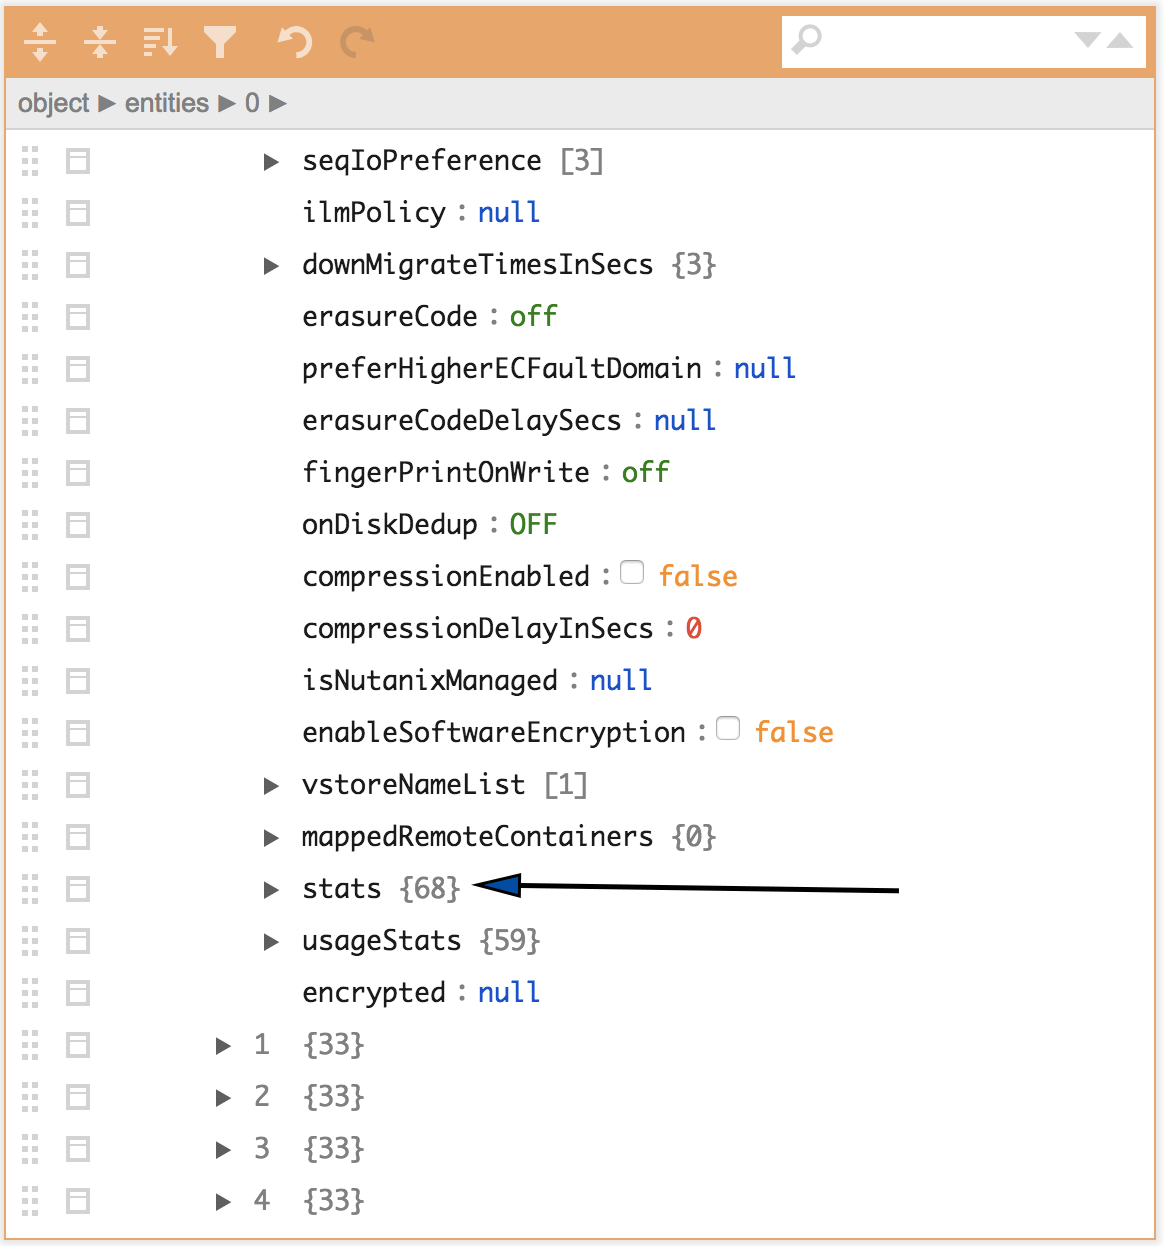
And, if we open up the ‘stats’ section, we get this. Each entity type will have its own entity-specific metrics associated with it.

Looking at that, we can see there are a lot of metrics available to us.
For the /storage_containers/ endpoint we are able to use each of those as a parameter to our actual request, thereby generating our storage performance stats. For the purposes of this article, let’s assume we want to look at a specific storage container’s I/O stats. To explain each part of the request that’s coming up shortly, here are the values we’ll use to construct our request. Note that your values will be different, of course.
- Container UUID: b2fefc62-6274-4c84-8e6c-a61f5313ea0e
- Cluster virtual IP address: 10.133.16.50
- Interval: every 30 seconds
- Start time in usecs: 1547510400000000 (00:00:00 on January 15th 2019)
- End time in usecs: 1547596800000000 (00:00:00 on January 16th 2019)
- Metric: controller_num_io
Assuming we have our authentication sorted out (the chosen method is up to you – see part 1 of this series), we can construct a complete HTTP GET request for this. The complete request looks like this:
https://10.133.16.50:9440/api/nutanix/v2.0/storage_containers/b2fefc62-6274-4c84-8e6c-a61f5313ea0e/stats/?metrics=controller_num_io&start_time_in_usecs=1547510400000000&end_time_in_usecs=1547596800000000&interval_in_secs=30Note for readers migrating from API v1: What is the first thing you notice in the v2.0 request vs v1 requests? Correct – v2.0 introduced a naming standard change for all API request parameters. For example, the start time in API v1 was startTimeInUsecs. In API v2.0 the same parameter is start_time_in_usecs. Note the change from camel-case to snake-case.
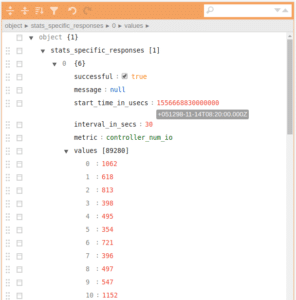
Continuing on – we requested stats every 30 seconds (interval_in_secs), which means we’ll get 2881 values in our response. We also requested data for a specific 24 hour period. Each value in the response represents that specific container’s controller I/O at that point in time.
Taking the entire response and processing it through JSON Editor Online allows us to easily see exactly what the response was:
With this information, we can process it or report on it any way we choose. For example, we could use PHP, Python, PowerShell or any other scripting/programming language of your choice to do something with that data, provided it can parse a JSON response.
You could, as an alternative, create a custom dashboard that shows specific cluster or entity information only. A real-world use case is implementing Nutanix APIs for a dashboard in a reception area. This theoretical customer didn’t want to show everything to the public, so created a custom dashboard to only show specific items.
v2.0 APIs in Prism Element “vs” v3 APIs in Prism Central
If you take some time to look through the Nutanix Developer Portal, you’ll see the Prism APIs are divided into two distinct sections: Prism Element (v2.0) and Prism Central (v3).
With the introduction of features and products like Nutanix Calm and Nutanix Flow, the entities you interact with will be different depending on where you’re sending the request.
For example, the v3 APIs can be used to consume information from Prism Central, the HTML5 multi-cluster and environment management UI. The v2.0 APIs can be used to consume information from Prism Element, the HTML5 management UI that runs on each individual cluster. While Prism Element can be registered against Prism Central, it isn’t mandatory. That said, it is worth noting that unless there’s a very good reason not to, we highly recommend deploying Prism Central in every environment. Many of the latest Nutanix products and features are available in Prism Central only.
To oversimplify things, Prism Element and Prism Central manage and expose different information. For this reason, the v2.0 APIs available in Prism Element are different from the v3 APIs available in Prism Central. Here are a few examples:
- VMs: Available in both Prism Element and Prism Central.
- Images: Available in both Prism Element and Prism Central.
- Blueprints: Available in Prism Central only.
- Apps: Available in Prism Central only.
- Storage containers: Available in Prism Element only.
The recommendation here is to make sure you do read through the Nutanix Developer Portal. This will help you make sure you are trying to access endpoints exposed by the correct service and that you know which endpoints are available to you. Hopefully this extended article helps someone and please stay tuned for more!